
> with(math):

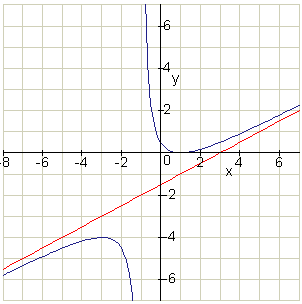
> f := x -> (1/2*x^3-3/2*x+1)/(x^2+3*x+2):

> a := un(asym(f(x))):  # see math[asym] and math[un]

> gridplot([f(x), a(x)], x=-8 .. 7, y=-7 .. 7,
>      discont=true,
>      step=[1, 1],
>      units=[2, 2],
>      gridcolor=wheat,
>      color = [navy, red],
>      axesfont=[HELVETICA, 10],
>      titlefont=[HELVETICA, BOLD, 12],
>      title=`Die Funktion f und ihre Asymptote a`);

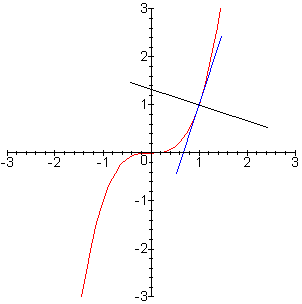
> curveplot(x^3, x=1, [normalline, tangentline],
>     x=-3 .. 3, y=-3 .. 3, tangcolor=blue,
>     scaling=constrained, length=3, normalcolor=black);

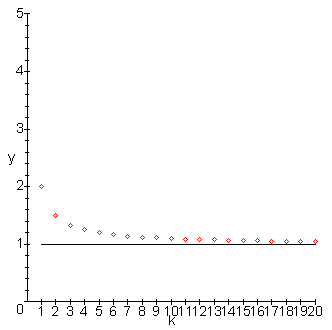
> seqplot(k/(k^2)+1, k=1 .. 20, y=0 .. 5, plotlimit=black);

Author: Alexander F. Walz, alexander.f.walz@t-online.de
Original file location: http://www.math.utsa.edu/mirrors/maple/mplmgra.htm