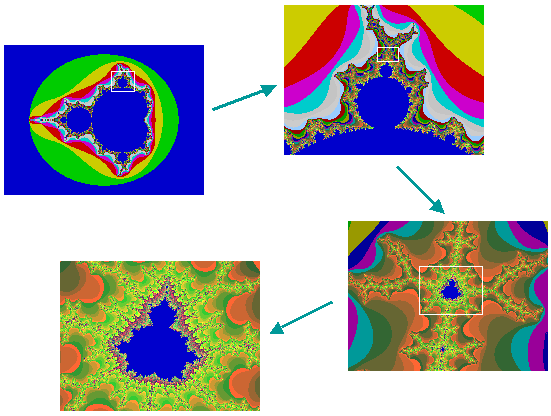

When you look closely at the structure, in many cases you will see a tiny fraction in it that resembles the whole (self-similarity).
A fractal is an infinite pattern compressed into a finite space.
An example: Zooming into the Mandelbrot set

The fractal is created using the surprisingly simple formula:
All the points in the complex plane are entered into that formula.
Each point is iterated n times using this formula, which creates a sequence of values.
When a point is entered into the formula in the beginning, a new point is determined. This point is entered into the formula again, etc.
Thus a sequence of points is created, e.g. with the original point [0.5, 0.3]:
[.5, .3], [.66, .60], [.5756, 1.0920],
[-.3611, 1.5571], [-1.794, -.8247],
[3.0389, 3.2593], [-.8880, 20.1093],
[-403.0945, -35.4141], ...
If all the values in the sequence are within a distance of 2 units from the origin, the original point is defined as being part of the Mandelbrot set.
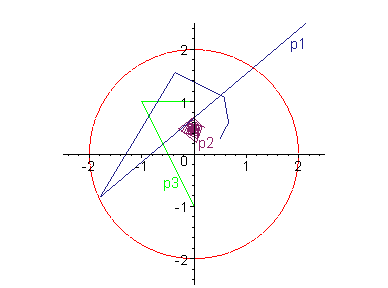
Let there be three points:
The plot shows so-called orbits, the paths the three points take during iteration:

You see that p1 = [0.5, 0.3] very soon leaves the radius of 2 units about the origin, thus it is not part of the Mandelbrot set.
p2 belongs to the Mandelbrot set, for its orbit does not leave the radius.
The same is for p3, but here we have a peculiar behavior: The iteration of p3 generates a periodical sequence: Its values just switch between three values: [0, 1.], [-1., 1.], and [0, -1.].
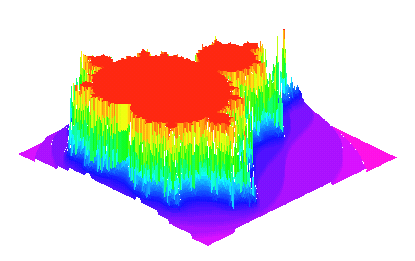
Thus we can draw 3-dimensional images. The higher a point is in the plot, the more iterations were performed on a point.

> lambdafn := proc(x, y)
>    local z, m, p1;
>    z := evalf(x+I*y);
>    for m from 0 to 50 while abs(z) < 4 do
>       z := sin(z)*1+I*0.4
>    od;
>    m
> end:

> plot3d(0, -1.5 .. 1.5, -1.1 .. 1.1, color=lambdafn, [...]);

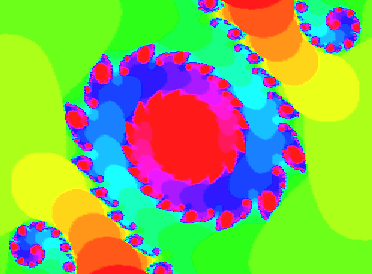
Since in this example we have the formula zn+1 := sin(zn)*p, with p = 1 + I*0.4 (the point [1, -0.4]), whereas the Mandelbrot set is generated using the formula zn+1 := zn2 + c, you see that fractals may appear very differently.


MAPLE V INTROFRACTALS #1.00 current as of May 23, 1999
Author: Alexander F. Walz, alexander.f.walz@t-online.de
Original file location: http://www.math.utsa.edu/mirrors/maple/mfrtut.htm